Home
Overview
This home provides a comprehensive view of the uploaded sales data, focusing on item performance, prediction confidence, and sales regularity. It's designed to offer quick insights into the inventory and sales patterns.
Description
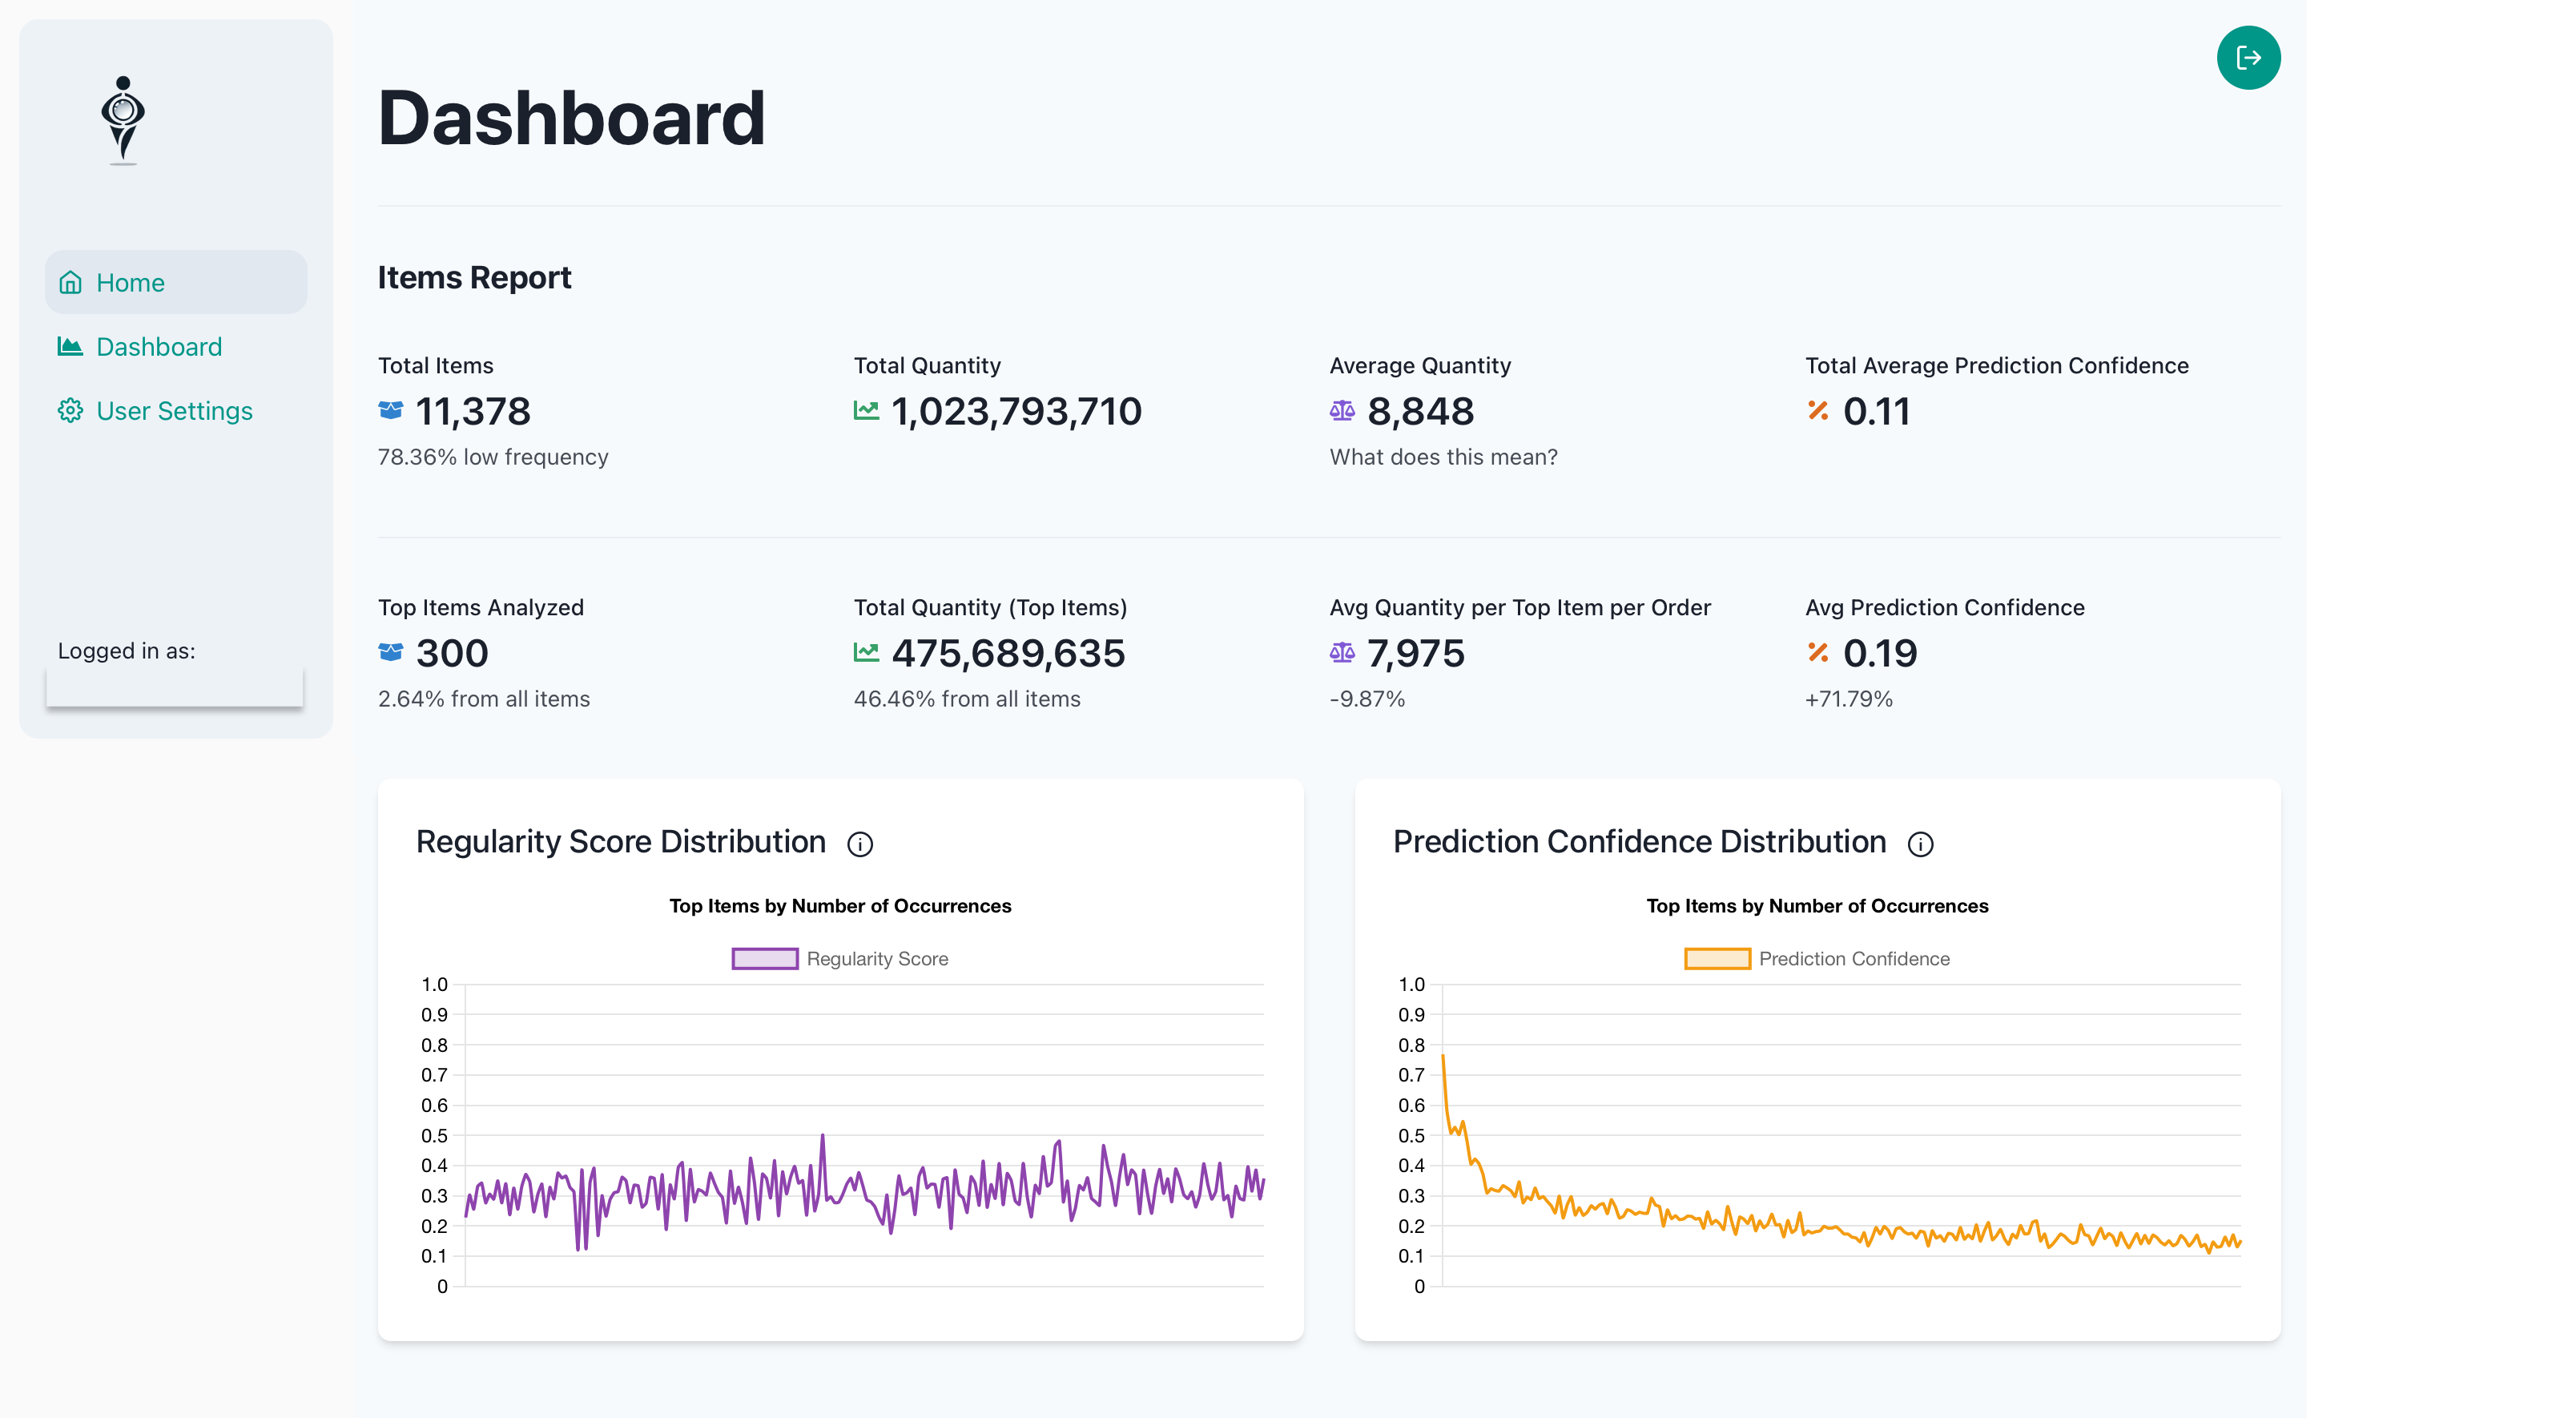
Items Report
Total Items
- This represents the total number of unique items in the inventory.
- Low Frequency Items: Calculated as the percentage of items that appear less than 10 times in the sales data.
- Calculation:
(Number of items with less than 10 occurrences / Total number of unique items) * 100 - This metric helps identify the proportion of items with infrequent sales, which may require special attention in inventory management.
- Calculation:
Total Quantity
- The total number of units sold across all items.
Average Quantity
- The average number of units sold per item.
- Calculated as: Total Quantity / Total Items
Total Average Prediction Confidence
- This score indicates the overall reliability of sales forecasts.
- A higher score (closer to 1) suggests more reliable forecasts.
- Calculated based on factors such as sales regularity, number of occurrences, and client diversity. (for further details check 'Prediction Confidence Distribution' chart below)
- This metric helps assess the overall predictability of sales patterns.
Top Items Analysis
Top Items Analyzed
- These are the items with the highest number of sales occurrences (rows in the uploaded dataset).
- Selection process: The items are sorted by their number of occurrences and the top N items are selected.
Total Quantity (Top Items)
- The total number of units sold for the top items.
- Also expressed as a percentage of all sales, indicating the concentration of sales in top items.
Avg Quantity per Top Item per Order
- The average number of units sold per order for the top items.
- Calculated as: Total Quantity (Top Items) / Number of Top Items
Avg Prediction Confidence
- The average prediction confidence for the top items.(for further details check 'Prediction Confidence Distribution' chart below)
- The number below shows the comparison to the overall average of the total items to indicate if top-selling items generally have more reliable forecasts.
Charts
Regularity Score Distribution
- This chart shows the distribution of regularity scores for the top items.
- X-axis: Shows the item code (the top items selected).
- Y-axis: Represents the regularity score, ranging from 0 to 1.
- Regularity Score calculation:
1 / (1 + (Standard Deviation / Average Quantity)) - A higher score (closer to 1) indicates more consistent sales patterns.
- Interpretation:
- High scores suggest items with stable, predictable demand.
- Low scores indicate items with highly variable sales, which may require closer inventory management.
- Note: A low regularity score does not necessarily mean that predictions for these items are poor. It simply indicates that the item's sales pattern is less regular, and thus more variables may need to be considered to make accurate predictions. These items may require more sophisticated forecasting models or additional contextual data for reliable predictions.
Prediction Confidence Distribution
- This chart displays the prediction confidence scores for the top items.
- X-axis: Shows the item code (the top items selected).
- Y-axis: Represents the prediction confidence score, ranging from 0 to 1.
- Prediction Confidence calculation:
(NumberOfOccurrences / NumberOfOccurrences.max()) * 0.3 +
RegularityScore * 0.3 +
(OrdersPerMonth / OrdersPerMonth.max()) * 0.2 +
(NumberOfClients / NumberOfClients.max()) * 0.2 - A higher score (closer to 1) suggests a more reliable sales forecast.
- Interpretation:
- High scores indicate items where our predictive models are expected to perform well.
- Low scores suggest items that may need manual review or additional data for accurate forecasting.
- Note: A low prediction confidence score does not necessarily mean that the predictions for these items are poor. It simply indicates that the item's sales pattern is less predictable, and thus more variables may need to be considered to make accurate predictions. These items may require more sophisticated forecasting models or additional contextual data for reliable predictions.
Additional Notes
- The home uses weekly aggregated data (W-SUN frequency) for consistency in analysis and forecasting.
- Predictions are made with multiple models and the best one is chosen for each item.
- The "Items Report" is generated for all items, while detailed analysis and charts focus on top-performing items to provide actionable insights for the most impactful part of the inventory.
Conclusion
This home offers a quick overview of the uploaded sales data performance, focusing on item regularity and forecast reliability. It helps identify which items have consistent sales patterns and reliable predictions, guiding inventory management and sales strategies. Regular review of these metrics can lead to improved stock management and more accurate sales forecasts.